# Well Stats User Guide
Well Stats is a Petro.ai data type which summarizes data and extracts features from multiple other Petro.ai data types on a per well basis.
Well stats will generate one row per well and aggregate or calculate columns for production, completion job, directional survey, decline curve, and cube (spacing) data.
The user can then leverage the aggregated data (features) to create visualizations and further calculations. Well Stats becomes especially powerful when used in conjunction with the Models tab in PetroPanel to create predictive machine learning models.
Download the result data dictionary here.
# Running Well Stats Job
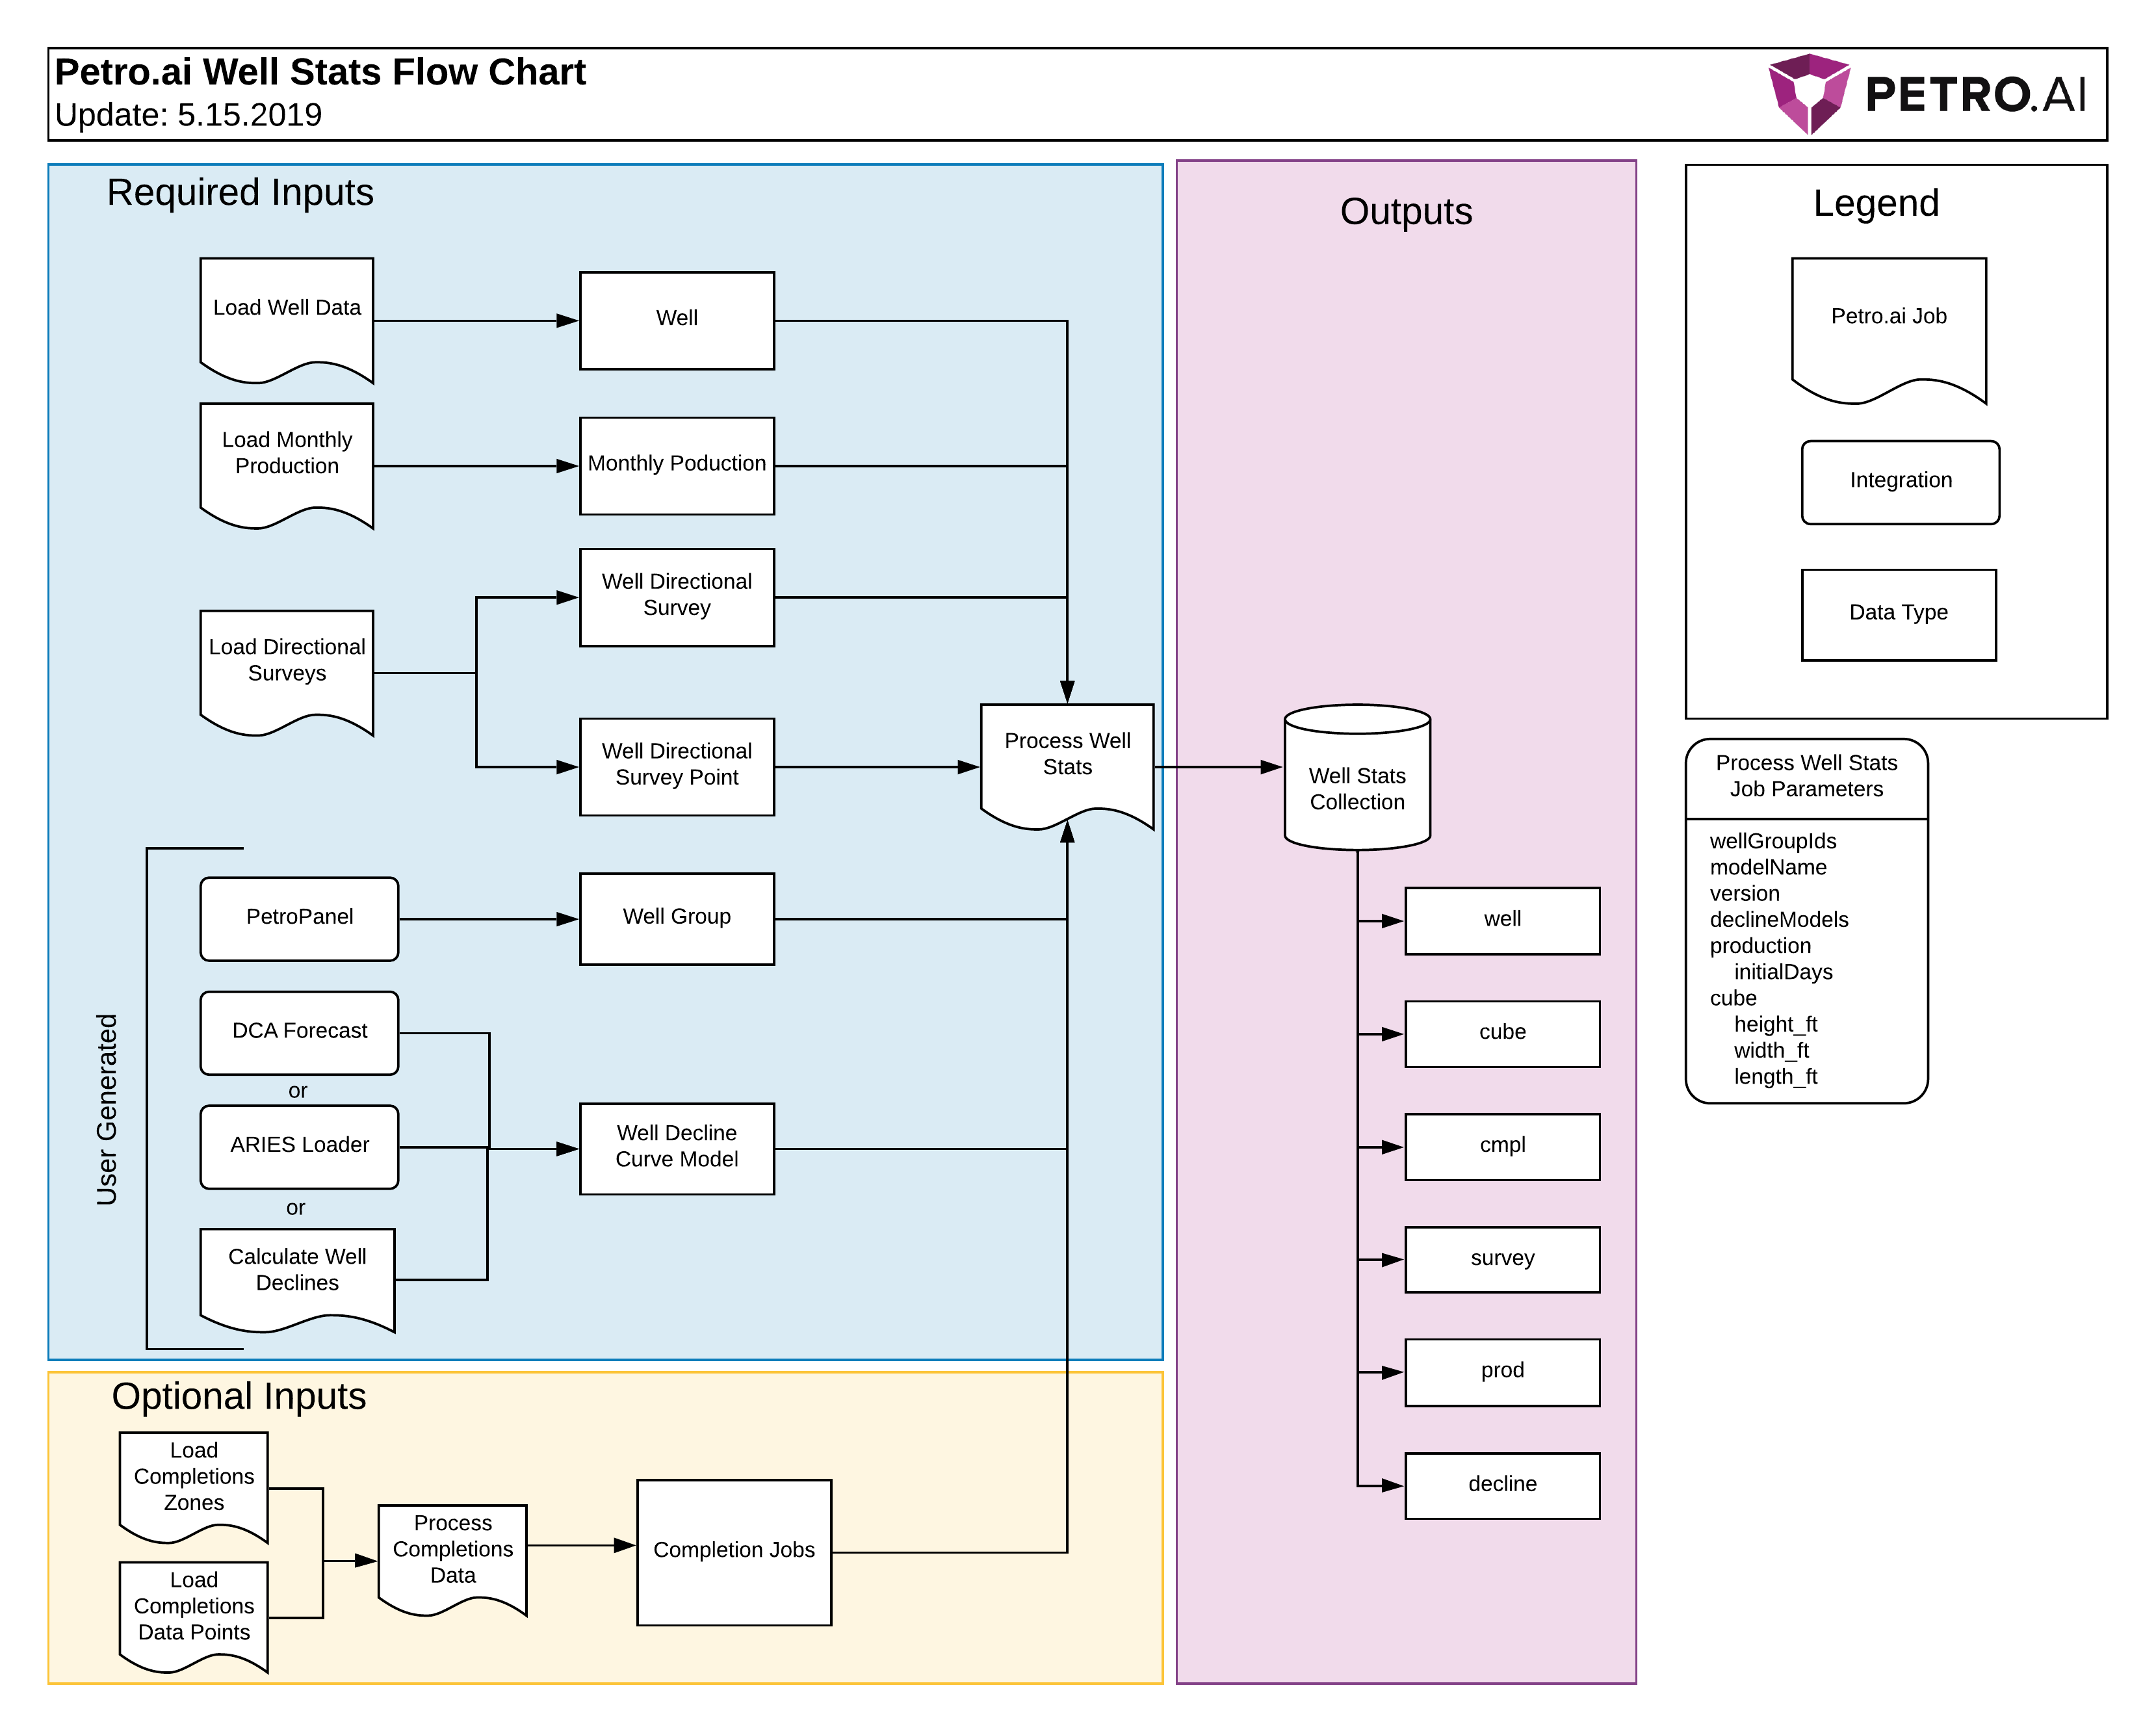
Well Stats pulls data from multiple Petro.ai collections, both required and optional ones. Make sure the required jobs have been run and completed before running the well stats job.
# Required Petro.ai Collections
Raw Data (Loaded via other Job Files in Job Manager)
- Well (from Load Well Data)
- MonthlyProduction (from Load Monthly Production)
- WellDirectionalSurvey (from Load Directional Surveys)
- WellDirectionalSurveyPoint (from Load Directional Surveys)
Calculated Data
WellGroup - create in Spotfire
- Fill out all fields on the Table Settings tab in the PetroPanel
- Mark a group of wells to be in your Well Group
- In PetroPanel’s Home tab, input a group name and click Create Well Group
WellDeclineCurveModel - three different methods available
- Create a decline model using the Petro.ai decline curve functionality
- Create in Job Manager using Calculate Well Declines
- Via the Aries Loader
Spacing (Cube) -- load parameters in Process Well Stats job in Petro Suite
- Height, width, length parameters define a cube
- Data pulled from Load Directional Surveys used to create a “neighborhood” cube with the above dimensions
- Features related to Well Spacing (number of wells, distance to closest well, etc) created for that cube
# Optional Petro.ai Data Table
- CompletionJob (from Process Completions Data, which is dependent on Load Completions Zones and Load Completions Data Points)
# Well Stats Job File Definitions and Notes
To run a Well Stats job:
- Go to the Job Manager and click Create New Job
- Fill in the Job Name
- In the Job Type dropdown, select Process Well Stats
- Click Load Job File Template
- Fill in the appropriate fields as defined below
TIP
Make sure to put quotes around the string values.
wellGroupIds (string): the id for the existing Well Group(s) to run Well Stats on
- Stats are aggregated PER WELL, so these groups only affect what wells are brought in, not any aggregation.
- One Group Id necessary but multiple allowed
wellGroupNames (string): the name for the existing Well Group(s) to run Well Stats on
- Currently can be left null. Incorporation of this field is on the development road map.
- If you do use it, make sure the names match the Ids brought in
modelName (string): name to use for the Well Stats model being created. Up to the user
version (float): version for that model
typeCurveModels (string): name of existing type curve model
- Currently can be left null. Incorporation of this field is on the development road map.
declineModels (string): name of existing decline curve models
initialDays (float): the duration in days which will dictate the term of initial production
- The Well Stats output table will have prod.ip columns for oil, gas, and water. The values will be the Max rate for the initialDays time period.
height_ft, width_ft, length_ft (float): the distances that will determine a cube around the well
- The cube will define a well’s “neighborhood” and stats regarding well spacing will be calculated about the neighborhood.
survey (string): survey id for wells in applied Well Groups
- Currently can be left null. Petro.ai will automatically find surveys associated with a well. Incorporation of this field in the job file is on the development road map.
JobName (string): name of the Job Manager job
- MUST be “calcWellStats”. This name is not a user input.
- Note that this differs from the Job Type, which was Process Well Stats.
LogInfo (string): the level of detail to be provided by the job log
- Currently can be left null. Incorporation of this field is on the development road map.
# Visualizing Results
# Loading Well Stats from the PetroPanel
To load Well Stats from the PetroPanel:
Load a Well Header
- Go to Actions > Add Actions
- Select Get Well
- At the bottom of the panel, name your New Table and click Create
Create a Well Group
- Fill out all fields on the Table Settings tab in the PetroPanel
- Open a Well Header table visualization
- Mark a group of wells to be in your Well Group using the marking selected in Table Settings
- In PetroPanel’s Home tab, input a group name and click Create Well Group
Load Well Stats
- Go to Actions > Add Actions
- Select Get WellStat
- At the bottom of the panel, name your New Table and click Create.
# Open a Well Stats Table
Open a Well Stats table visualization and scroll through the columns tocheck the resulting columns and their values
# Output Definitions
# Data Types
The Well Stats table will contain groups of variables for each data type it outputs, denoted in its variables with the following prefixes:
| Context | Description |
|---|---|
| well.* | Well Header data from Load Well Data |
| cube.* | Well Spacing derived from Process Well Stats job (based on the Job File’s parameters). Each well has its own cube. |
| cmplJob.* | Completions data derived from Process Completions Data job |
| survey.* | Survey Data derived from Load Directional Surveys job |
| prod.* | Monthly Production derived from Load Monthly Production job |
| decline.* | Decline Curve data created with Petro.ai’s Decline Curve tool, derived from Calculate Well Declines job, or loaded via Aries Loader |
Columns
Definitions for output columns can be found in the Well Stats Data Dictionary.