# Maps
# Overview
The map visualization can be found on the MAP tab. Users can view, select, create type curve groups, and add or remove wells from a Petron on this page.
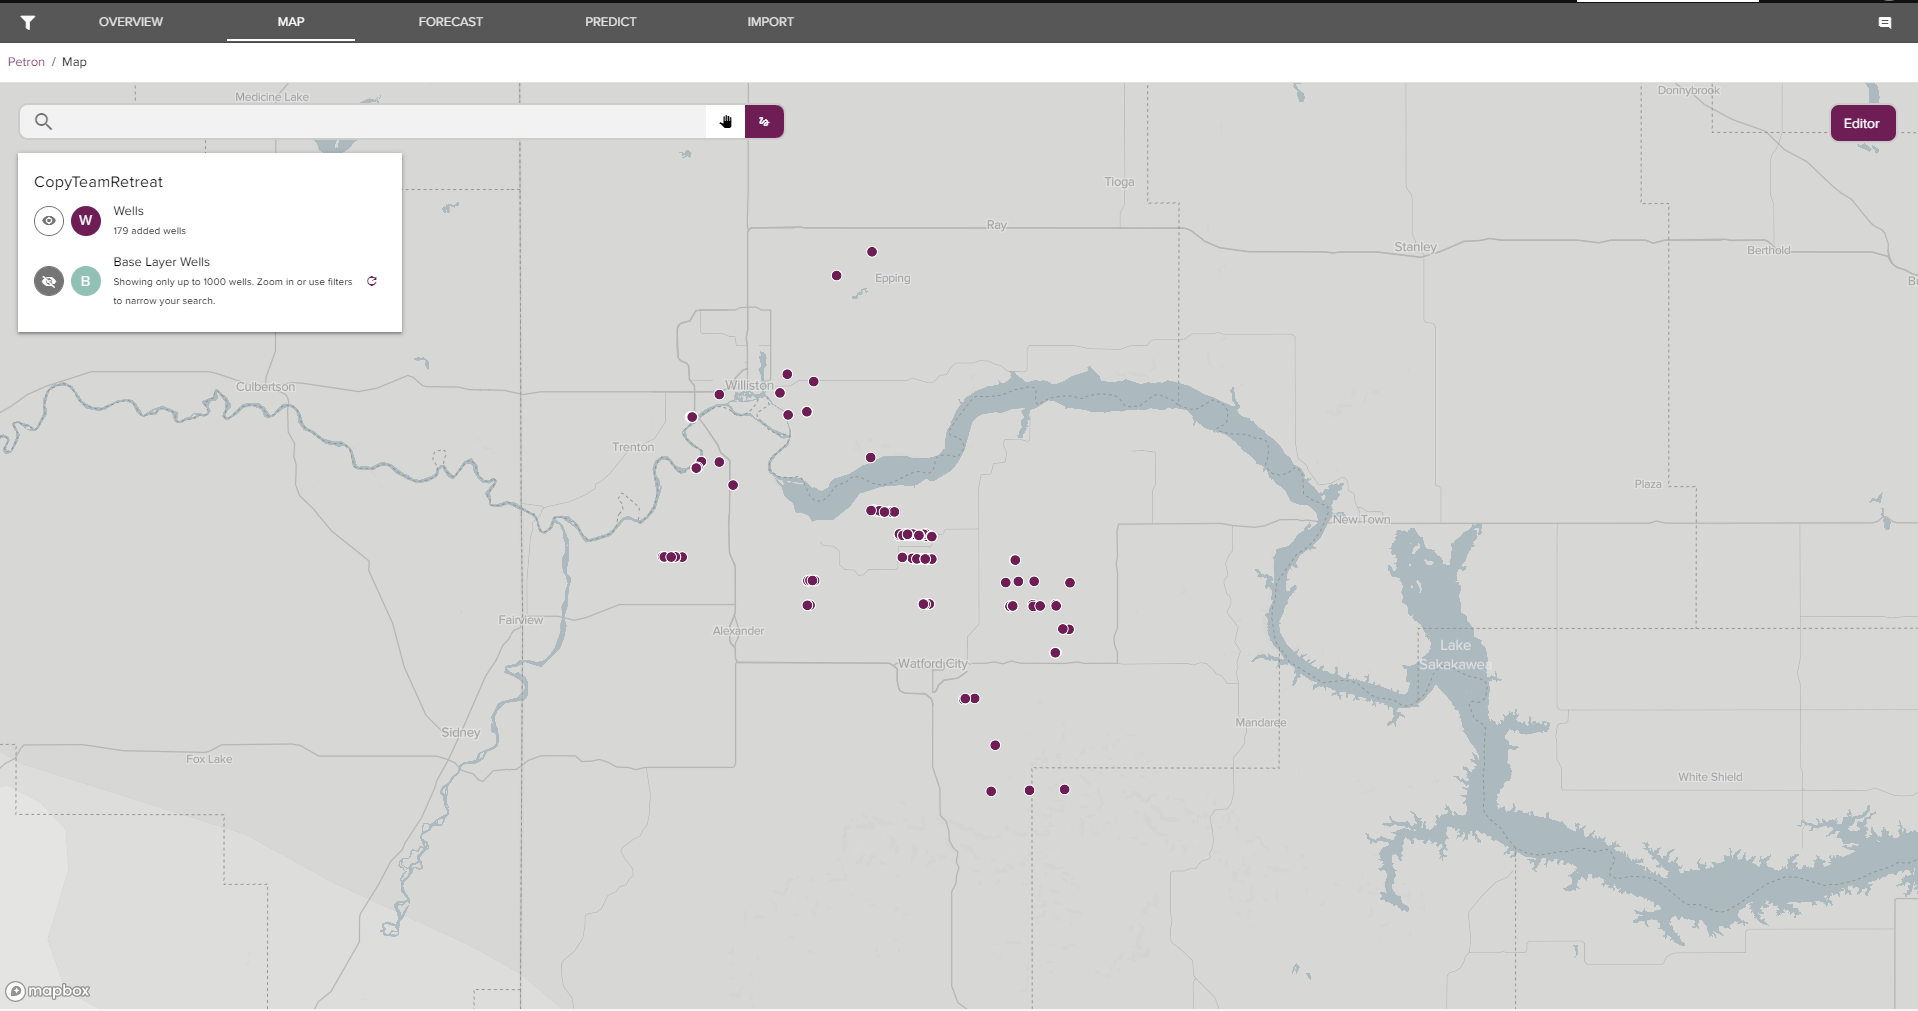
The map visualization contains three layers, where the background map forms one layer, and the markers representing the actual well location data of the Petron wells and the Base Layer Wells form the other two interactive layers. The legend, navigation controls, and interaction controls are located on the upper left side in the visualization. The type curve editor is located in the upper right hand side in the visualization.
# Navigation and Interaction Controls
Navigation and interaction controls for panning and well selection are located in the upper left side in the visualization.

The hand icon is used for panning mode, the lasso is used for well selection. Switch between the two by clicking on the desired mode.
Zooming is controlled by the scroll function on the users mouse.
# When in panning mode, 
| Shortcut | Description |
|---|---|
| Zoom | Mouse scroll up and down |
| Pan Left | Left arrow key |
| Pan Right | Right arrow key |
| Pan Up | Up arrow key |
| Pan Down | Down arrow key |
| Rotate | Press and hold Shift and left or right arrow key |
| Tilt Horizontal | Press and hold Shift and up arrow key |
| Tilt Vertical | Press and hold Shift and down arrow key |
# Interaction Controls
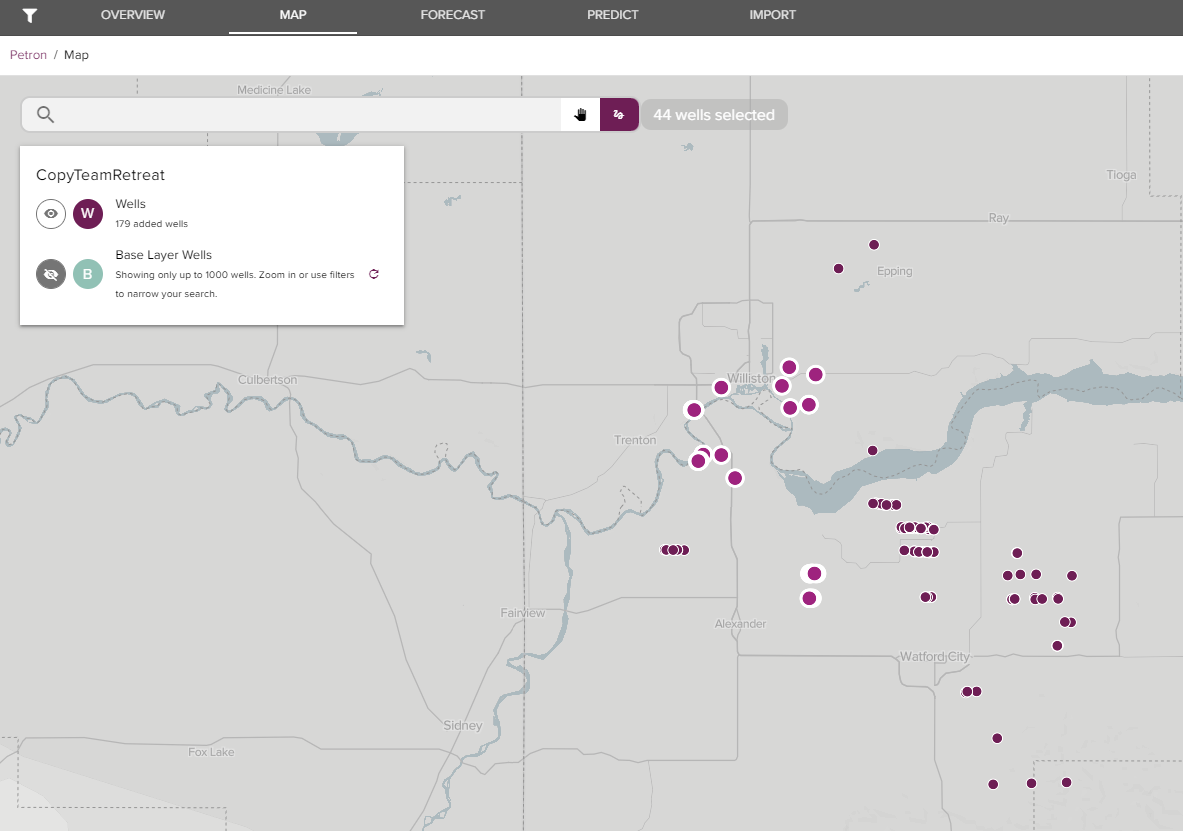
The lasso is used for well selection. When clicked on the user may click and hold the left mouse button and lasso around desired wells. Once selected the wells will display as highlighted items in comparison to the non-selected wells.
An interaction legend will appear once items are marked. This will provide a unique count of the wells in the users current selection.
Below you can see a map with no wells selected.
The same map as above, but with with selected wells.
# Search Bar
The search bar is located in the upper left side of the visual, adjacent to the navigation controls. The search bar allows the user to search and select specific wells or type curves groups.
# Editor
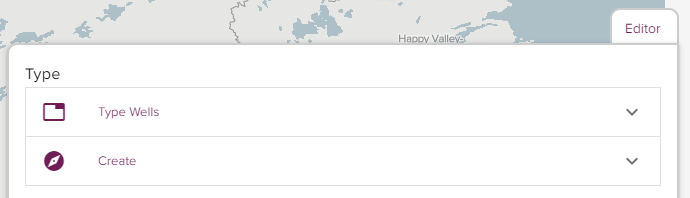
The editor can be found in the upper right side on the Map visualization. The editor allows the user to create type curves groups on selected wells on the map.
| Type Curve Editor | Description |
|---|---|
| Create Type Curve | Expand the Create Dropdown |
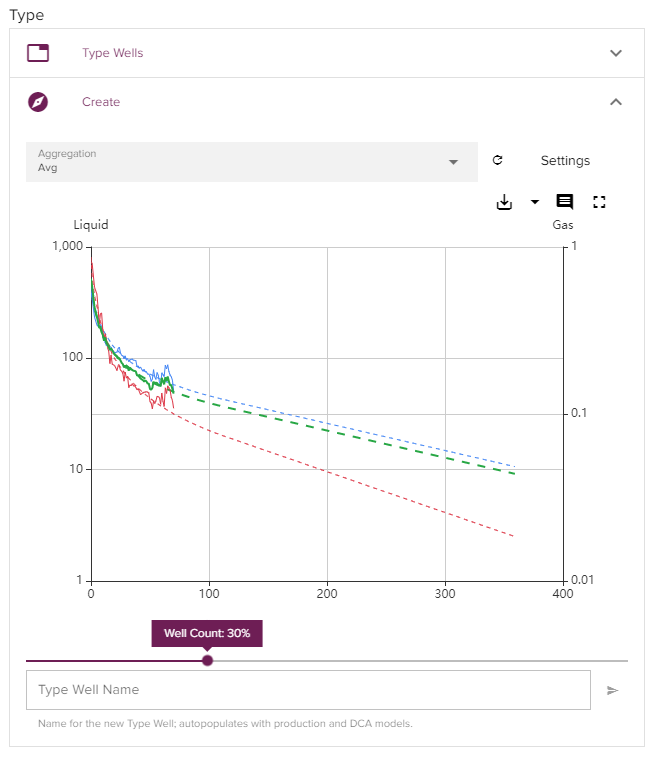
| Execute Type Curve Group | Select an aggregation method and click the refresh icon. This will create a type curve of the selected well group |
| Adjust Parameters | The user can adjust the type curve parameters by clicking "Settings". Please find type curve parameter documentation here |
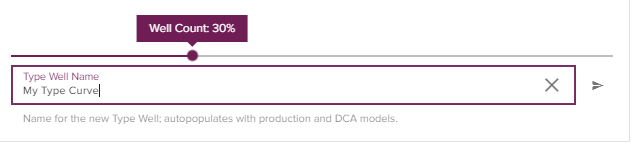
| View Data | The user can save, export, adjust well count, comment on, or expand the type curve visual by clicking various icons located directly above the type curve visualization |
| Save Type Curve | The user can save the type curve by entering in a type curve name in the area below the visual |
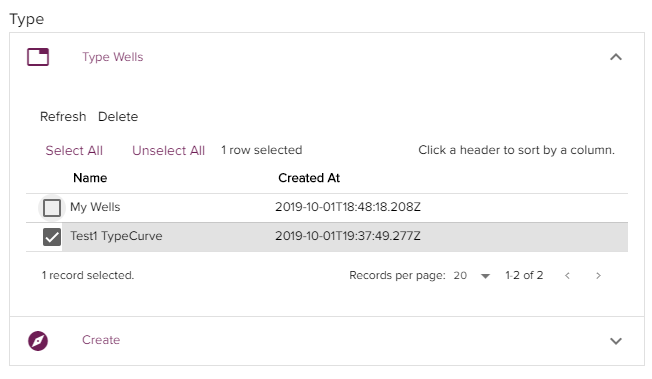
| Expand the Type Wells Dropdown | Select user generated type curve groups |
Create Type Curve Group
Name Type Curve
Edit Type Curve Wells
# Legend
The legend can be found in the upper left side of the visualization, directly below the navigation controls and search bar.
The legend identifies the current Petron, the wells inside that Petron, and all the other wells within the Petro.ai system.
The user has the option to visualize both, neither, or one of the well layers. This gives the user the ability to add or remove wells from the specified Petron.

The user can toggle well layers on and off by using the "eye" icon
Wells
Wells contains all wells within the Petron. The ledgend provides a unique count of wells within the Petron. The user can toggle the "eye" icon on to display the wells layer.
Base Layer Wells
Base Layer Wells contains all wells not included in the Petron but within the Petro.ai system. This layer can show up to 1000 wells at a time, the user can zoom in or use filters to narrow the search. By toggling the "eye" icon on the user can display the wells in this layer.
# Additional Functionality
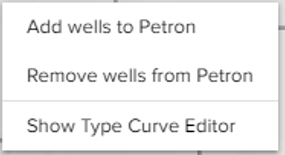
The map visualizations has the additional functionality to add and remove wells from a Petron. Right mouse button the map to perform the following actions.
| Functionality | Description |
|---|---|
| Adding and Removing Wells from Petron | Toggle on both Base Layer Wells and Wells, Toggle on lasso in navigation menu and select a group of wells |
| Remove Wells from Petron | This will remove wells from the current Petron specified in the Legend |
| Add Wells to Petron | This will add wells to the current Petron specified in the Legend |
| Show Type Curve Editor | This will Open the Type Curve Editor |
| Hide Type Curve Editor | This will close the Type Curve Editor if it is already open |
# What To Do Next
After a user has selected wells on the map the wells can be viewed on the FORECAST and PREDICT tabs.